Maudlin
Before this, I had written a lot of scrapers, but never a crawler, and I'd never tried scrapy. So I wanted to build a crawler with scrapy, use it to generate sentiment analysis of news articles, and see what news agencies were the most happy or sad or neutral.
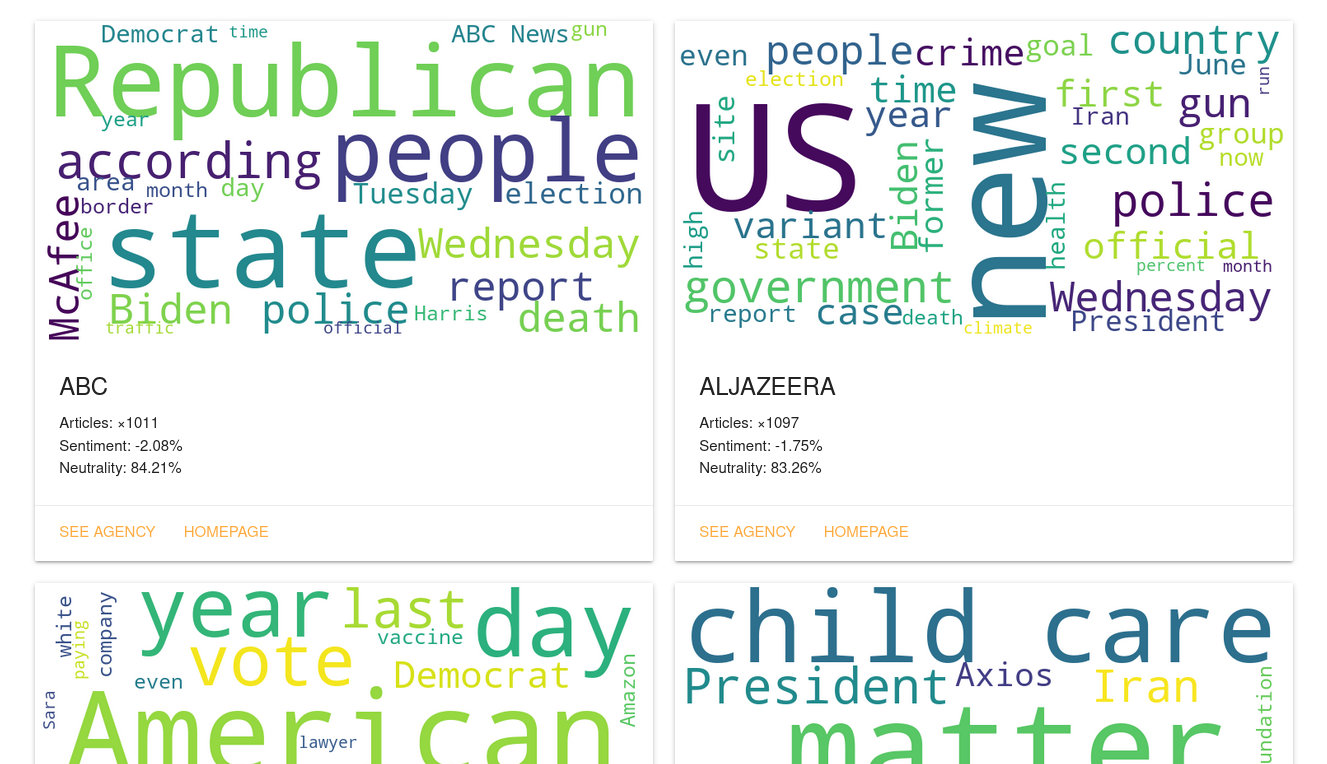
So far I've written 41 scrapers, some with selenium, some with just scrapy's request system, and added each one to a crontab to run at varied intervals. I used sqlalchemy to store the articles and agencies, and then built a flask site to display the information, with materialize css as a basic css framework to make it look semi-spiffy. Then I added in a word cloud for each news agency for the day, and the result is always running. The front page shows what spider is running at any given time, so sometimes you might see it say "CNN" or "ALJAZEERA" is running.
The initial deployment was on a raspberry pi 4, but it became just too much for the little guy and I moved up to a desktop running headless Arch I had lying around. Then, when I started to get concerned with the future of the project I split it up: the database and website are hosted on Digital Ocean, the scraper runs on my local Arch machine. I use a big crontab to manage all the scrapers (most run every hour, staggered; a few that are longer-running (i.e., using Selenium), run every 2 hours).
I did some back of the envelope calculations to figure out if a cheap basic droplet would have enough storage space for all my articles, and at the rate the database grows it seems I'd end up taking about a year per gigabyte. At 25gb for a basic level droplet, that's about 25 years before I'd have to upgrade storage.
It's up to over a hundred thousand articles now, and one the things I found interesting was how many old articles have been added. It only queries the front page of any news agency, but sometimes they feature articles from their archives. Especially the New Yorker.
One of the most interesting things to do in this project was figure out how to represent the sentiment as a color. I wanted neg/pos sentiments to be displayed as a gradient between red and green. Turns out, you can literally just represent any two points in hex color space as points on a graph and to find the point in the gradient you just take the distance. The code's here, if you want to see it.