How to Draw a Circle 2021-10-02
Lately I've been studying some Linear Algebra and felt like dipping my toes back into some generative art.
It seems, whenever I start doing something like this my first step is to draw a circle by radiating spokes from the origin. I always have to sort of rediscover the math from first principles, so I felt like writing a quick post about it. I'm going to walk through how I was thinking about this from scratch.
I'm using p5.js for these pictures.
First let's define our canvas:
DIM = [500,500];
ORIGIN = DIM.map((el)=>el/2);
This is obvious enough. Now, p5.js has two main functions: setup and draw
which are pretty obvious.
function setup() {
  createCanvas(...DIM);
  background(255);
}
Color functions take a variety of arguments. In this case, we're
using one argument to define intensity of RGB I guess, 255 is #FFFFFF, or all
full RGB or white.
I'm going to do this with only three drawing functions: line, which takes an
origin and end point, strokeWeight, which defines the line's width, and
stroke which defines the line's color.
Let's just get something on screen.
function draw() {
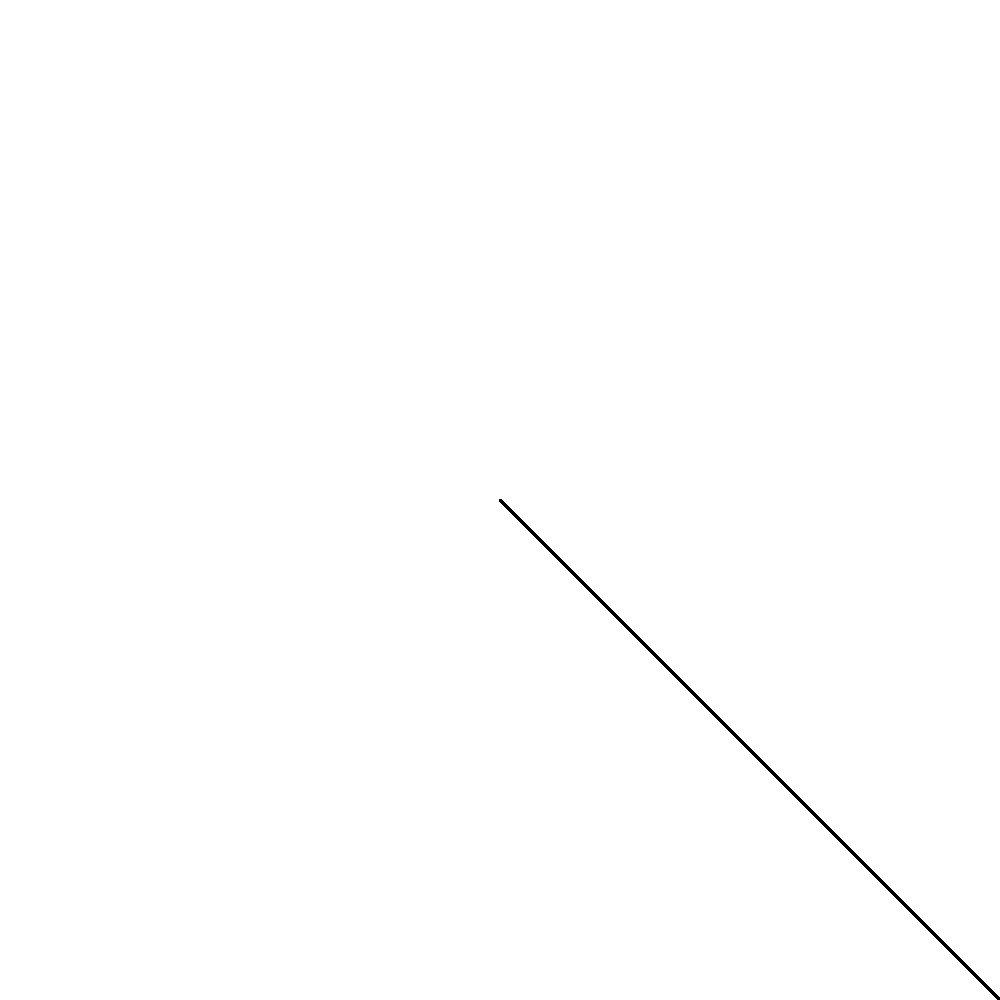
line(...ORIGIN, ...DIM);
}
This just draws a line from the center to the bottom right (coordinates are
defined with (0,0) at the top left and increasing right and down, as with most
systems).
Okay, now let's try looping over 360 degrees:
function draw() {
  for (let i = 0; i <= 360; i++) {
    line(...ORIGIN, i, i);
  }
}
This will be hideously wrong, but I start naive. Always.
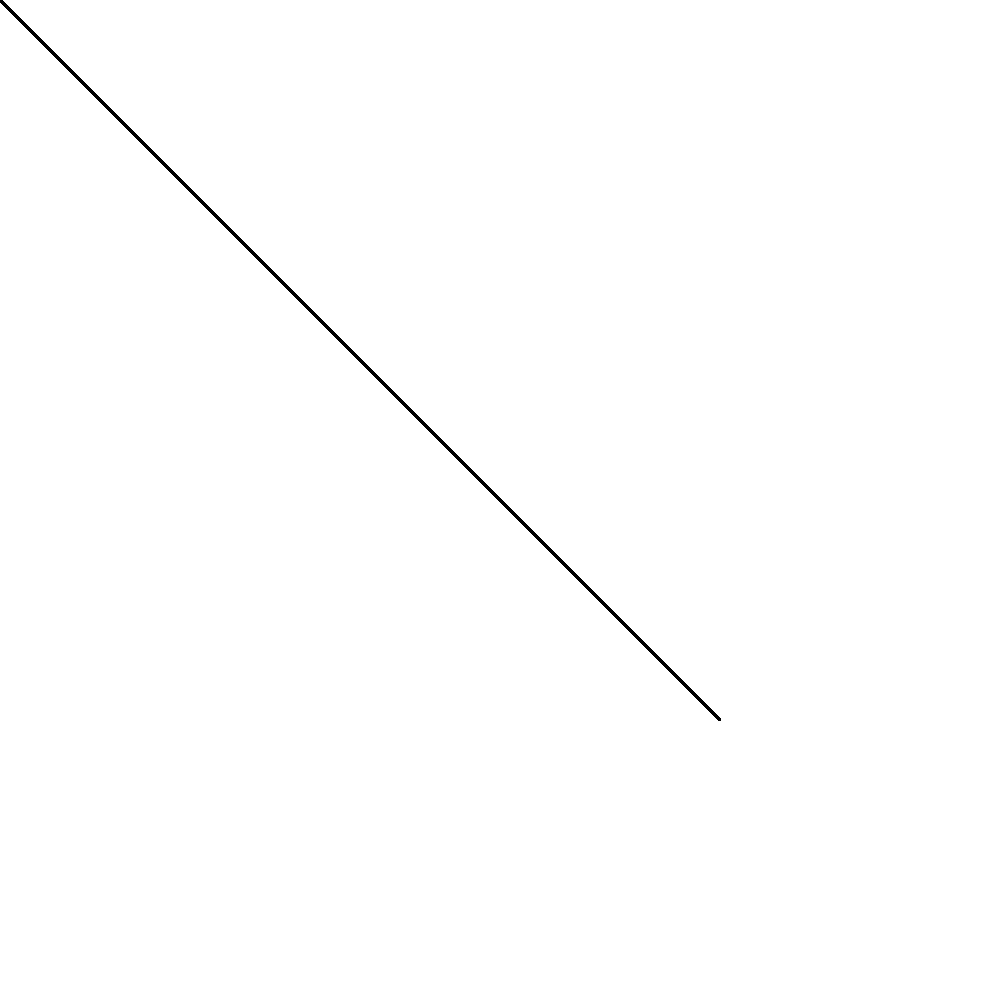
Okay, we know, obviously, that we're drawing a lot of lines from (0,0,250,250)
to (360,360,250,250) which is pretty meaningless, it's obviously a diagonal line
because i=i. Let's try some trigonometry.
We know that every point on the unit circle can be described as a vertex on a right triangle. Since this triangle is right, getting coordinates with some trig shouldn't be too hard.
This is a classic Unit Circle (sourced from Wikipedia). Every point on the unit circle can be represented as $(\cos{\theta}, \sin{\theta})$. But $\theta$ is a radian, so let's do that right.
We know that $360° = 2 \pi$, so translating a degree to a radian as easy:
rad = 360 / (2 * Math.PI);
Now, let's draw a circle:
function draw() {
  rad = 360 / (2 * Math.PI);
  for (let i = 0; i <= 360; i++) {
    line(...ORIGIN,
      Math.cos(i*rad),
      Math.sin(i*rad)
    );
  }
}
Well that's not doing it. Let's think about this.
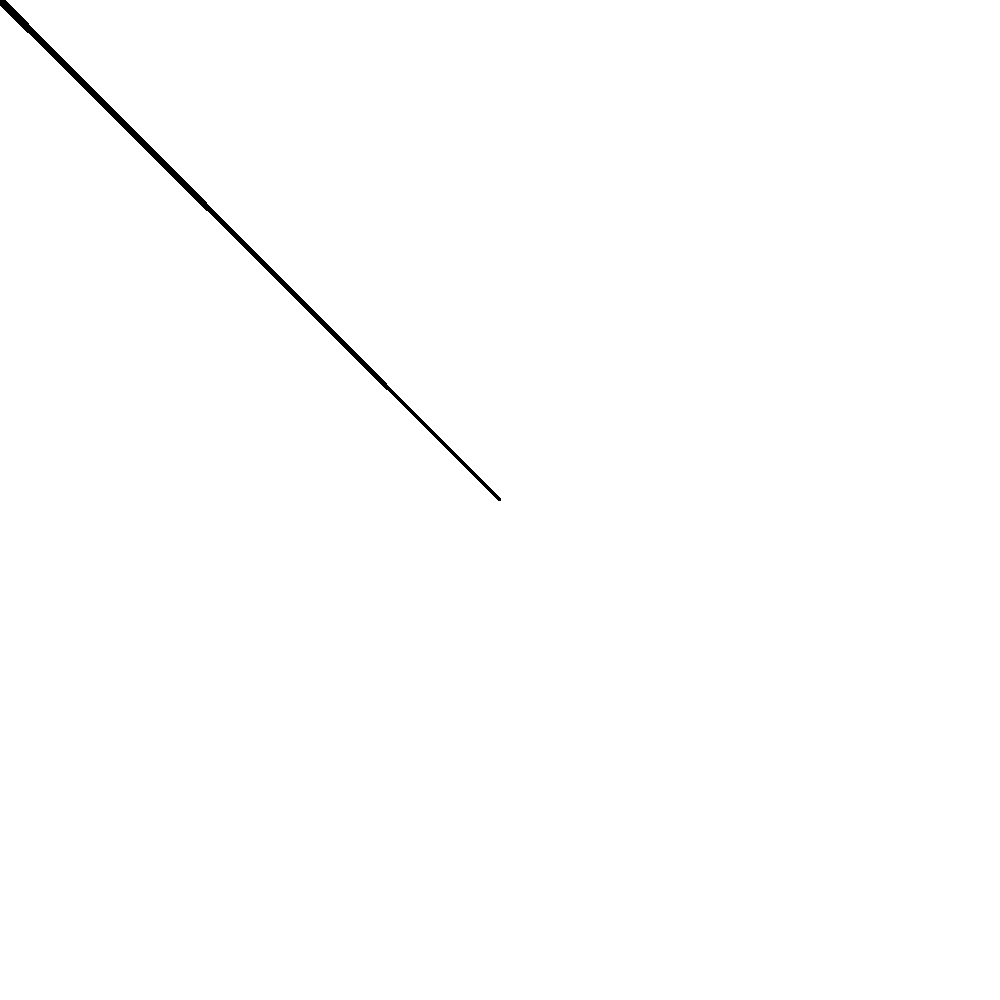
We're definitely converting our $\theta$ from degrees to radians. But now that I
think of it, the output of each of Math.sin and Math.cos has got to be
${\alpha : -1 \leq \alpha \leq 1}$, so we're just drawing a lot of lines from
the origin to a circle around the pixels in the top left corner. Really it's
just a square because it's the top circling around the top pixel and 3 pixels
outside the frame.
So let's recenter to the origin.
function draw() {
  rad = 360 / (2 * Math.PI);
  for (let i = 0; i <= 360; i++) {
    line(...ORIGIN,
      ORIGIN[0] + Math.cos(i*rad),
      ORIGIN[0] + Math.sin(i*rad)
    );
  }
}
Beautiful, we have a dot. Our radius is 1 pixel, so it's a 2x2 pixel square around the origin. Let's adjust the radius.
function draw() {
  radius = 250;
  rad = 360 / (2 * Math.PI);
  for (let i = 0; i <= 360; i++) {
    line(...ORIGIN,
      ORIGIN[0] + Math.cos(i*rad)*radius,
      ORIGIN[0] + Math.sin(i*rad)*radius
    );
  }
}
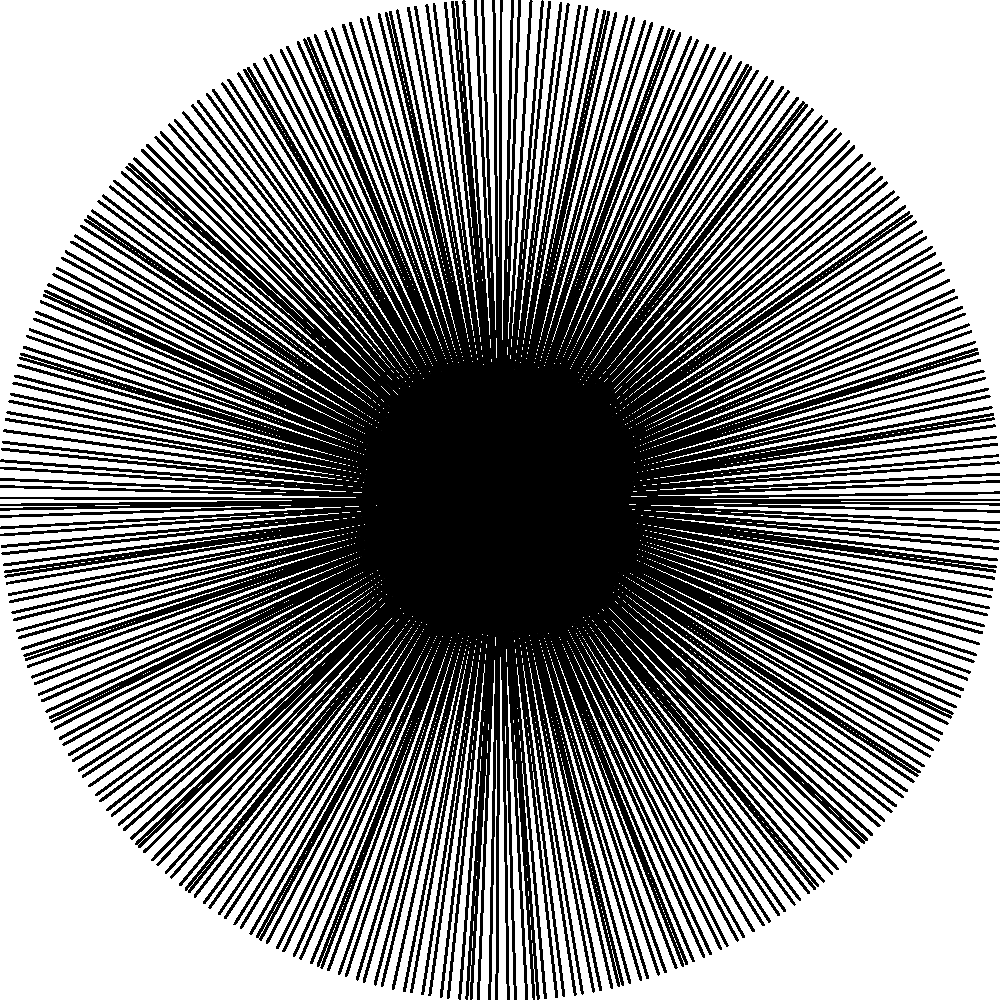
Hey, we got a circle! Nice.
Technically this is all we needed. But let's try giving it some varied color.
We've got a nice variable i right there that describes a circle in 360
degrees. We could use the same sin wave we've already got to give our 3 colors
different degrees. Remember, the outputs of sine and cosine are always between
-1 and 1, so since our color scale is from 0 to 255 we'd basically have just
black lines if we don't normalize our scale to 255.
Since -1*255 is -255, we should move our color scale up to [0,2] by adding 1 to the output of sine and cosine.
s = 1 + Math.sin(i);
c = 1 + Math.cos(i);
Then we should scale to 255. We can't just multiply by 255, though, because when either sine or cosine equal 1, s and c = 2, so $s \cdot 255 = 510$. Let's instead scale by half of 255, so 127.5.
s = (1 + Math.sin(i)) * 127.5;
c = (1 + Math.cos(i)) * 127.5;
function draw() {
  radius = 250;
  rad = 360 / (2 * Math.PI);
  for (let i = 0; i <= 360; i++) {
    line(...ORIGIN,
      ORIGIN[0] + Math.cos(i*rad)*radius,
      ORIGIN[0] + Math.sin(i*rad)*radius
    );
    s = (1 + Math.sin(i)) * 127.5;
    c = (1 + Math.cos(i)) * 127.5;
    stroke(s, s, c);
  }
}
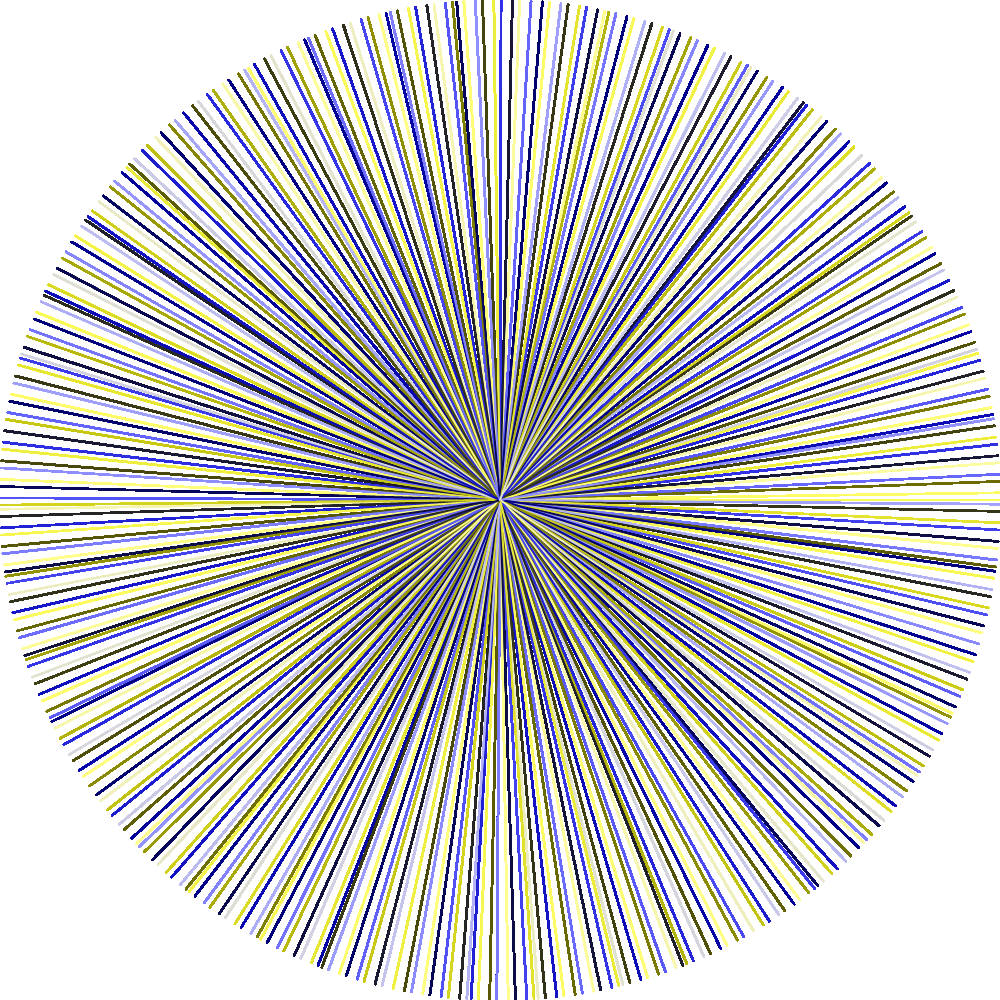
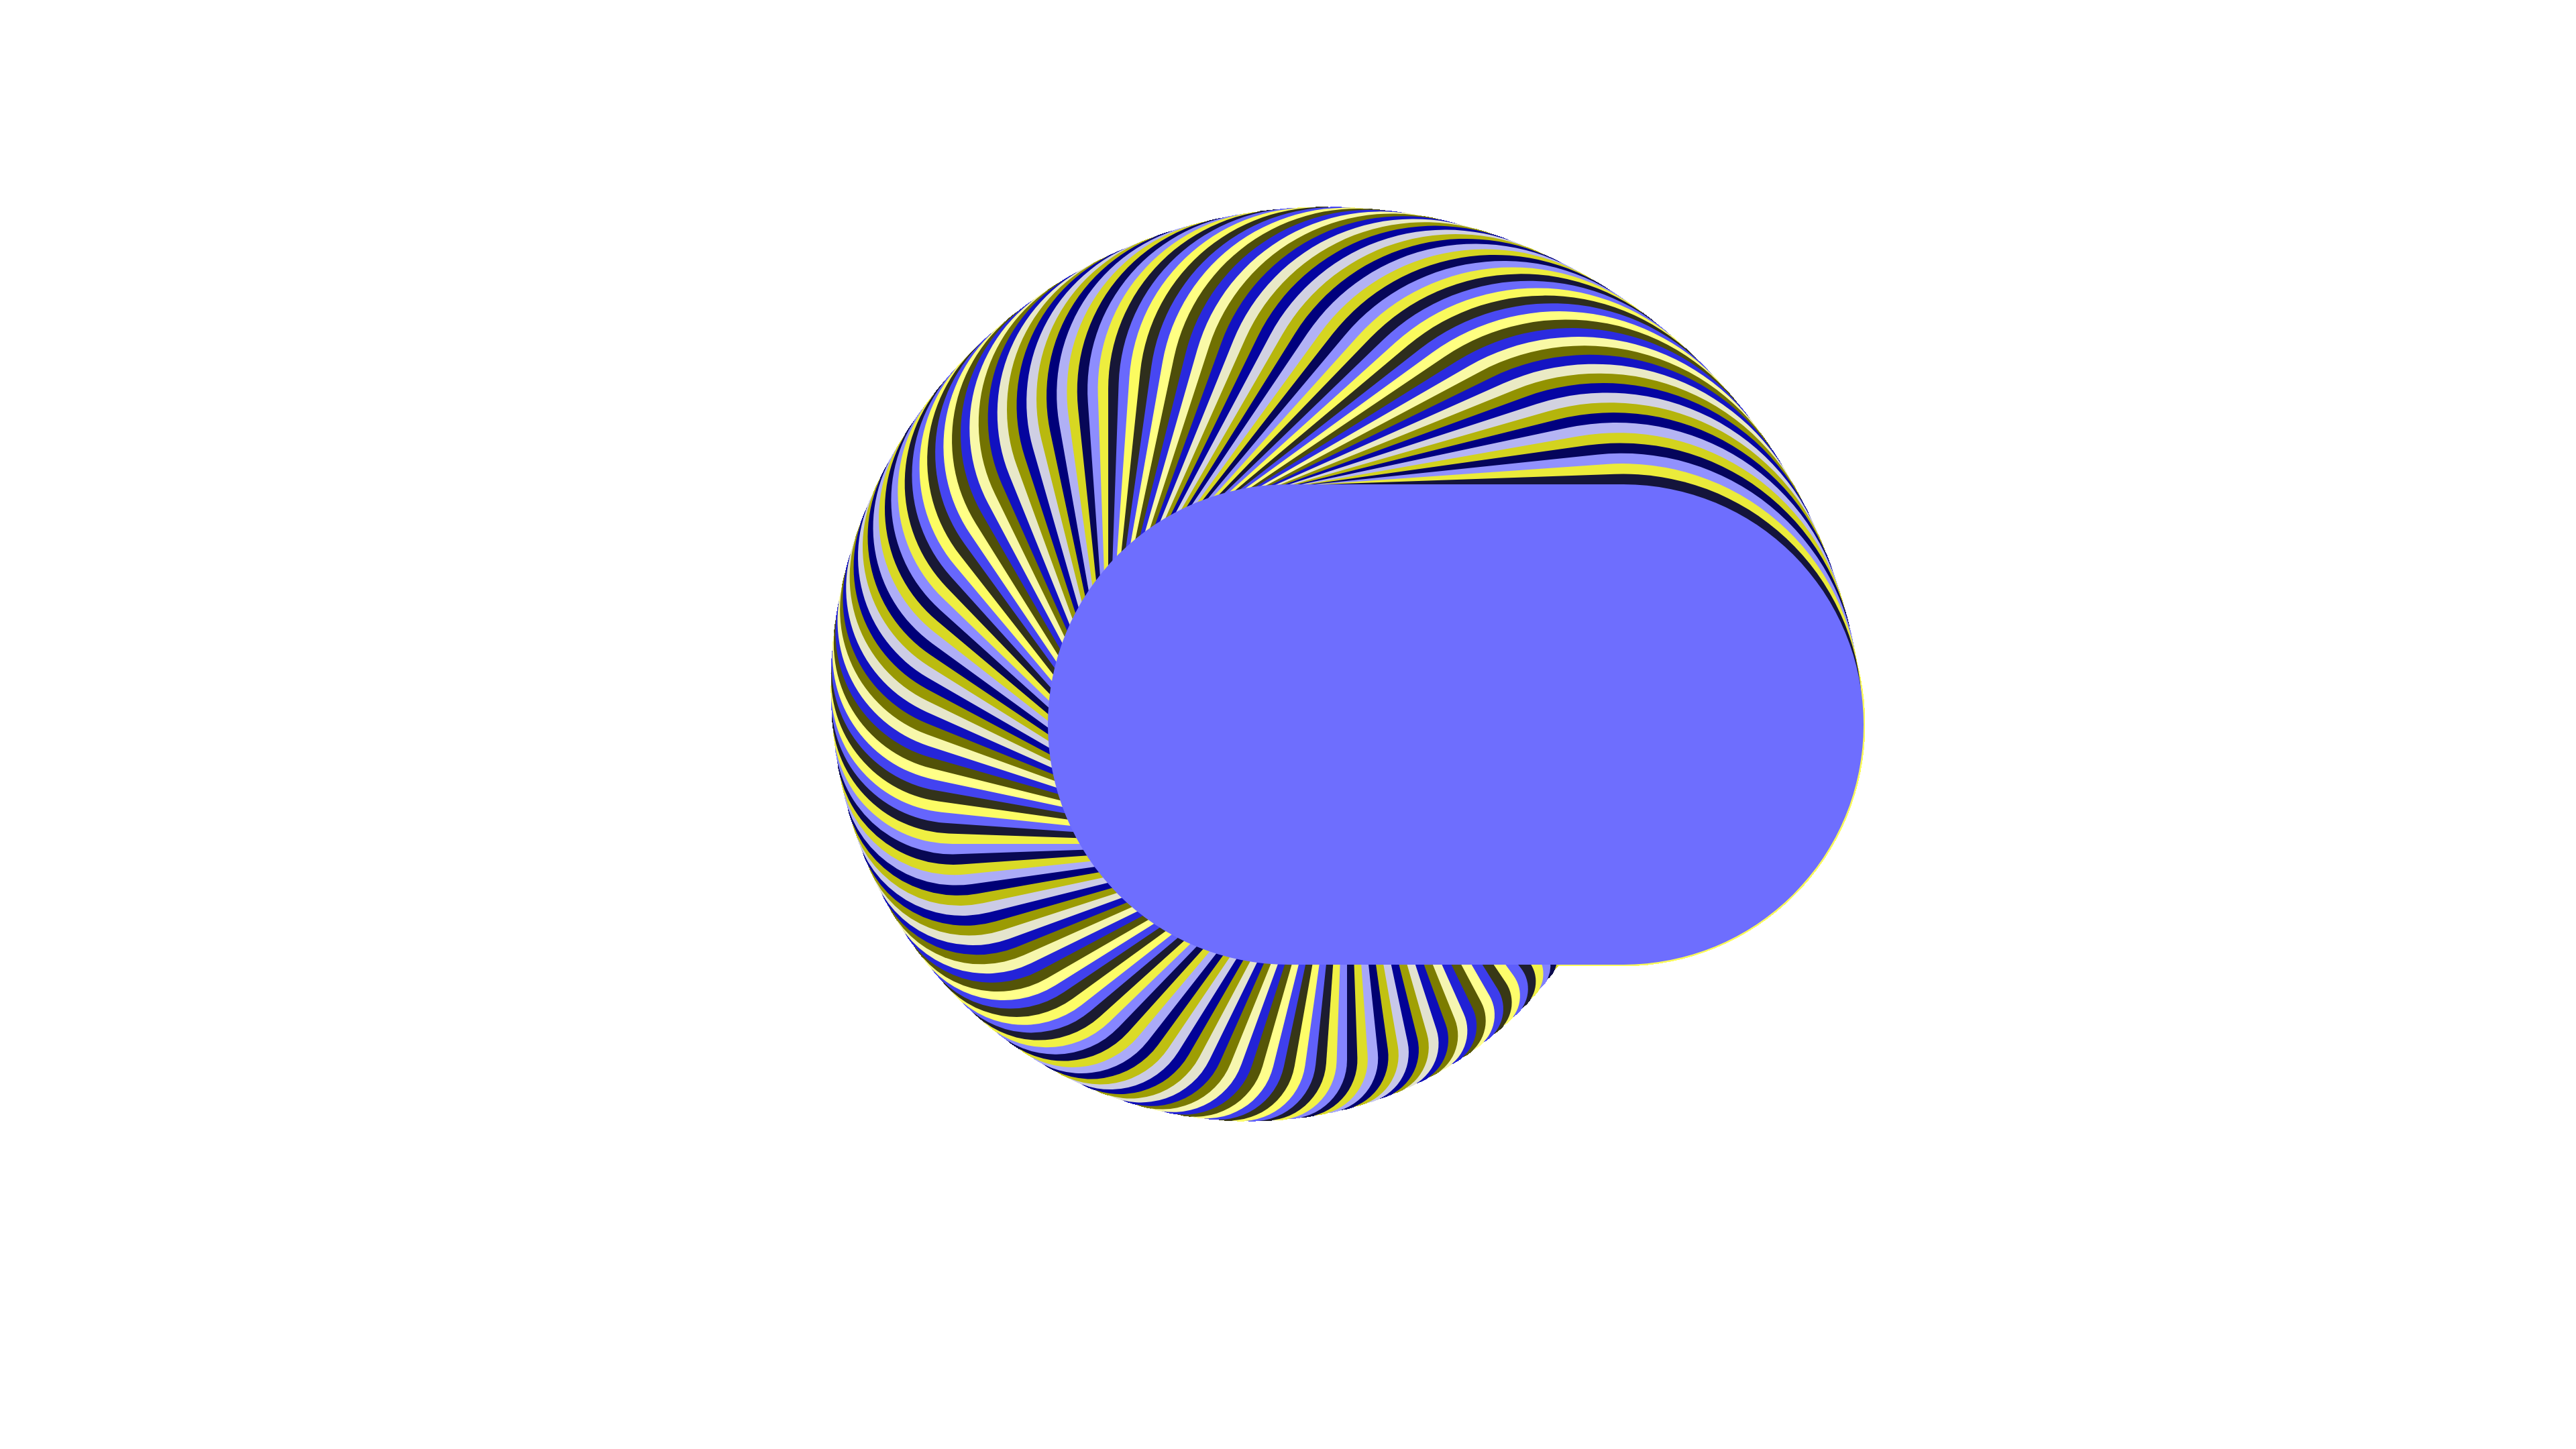
So right here I wanted to start experimenting with size and got a happy accident
I'd like to checkpoint as I was troubleshooting gain. If you just change DIM
to [1920,1080] you get this:
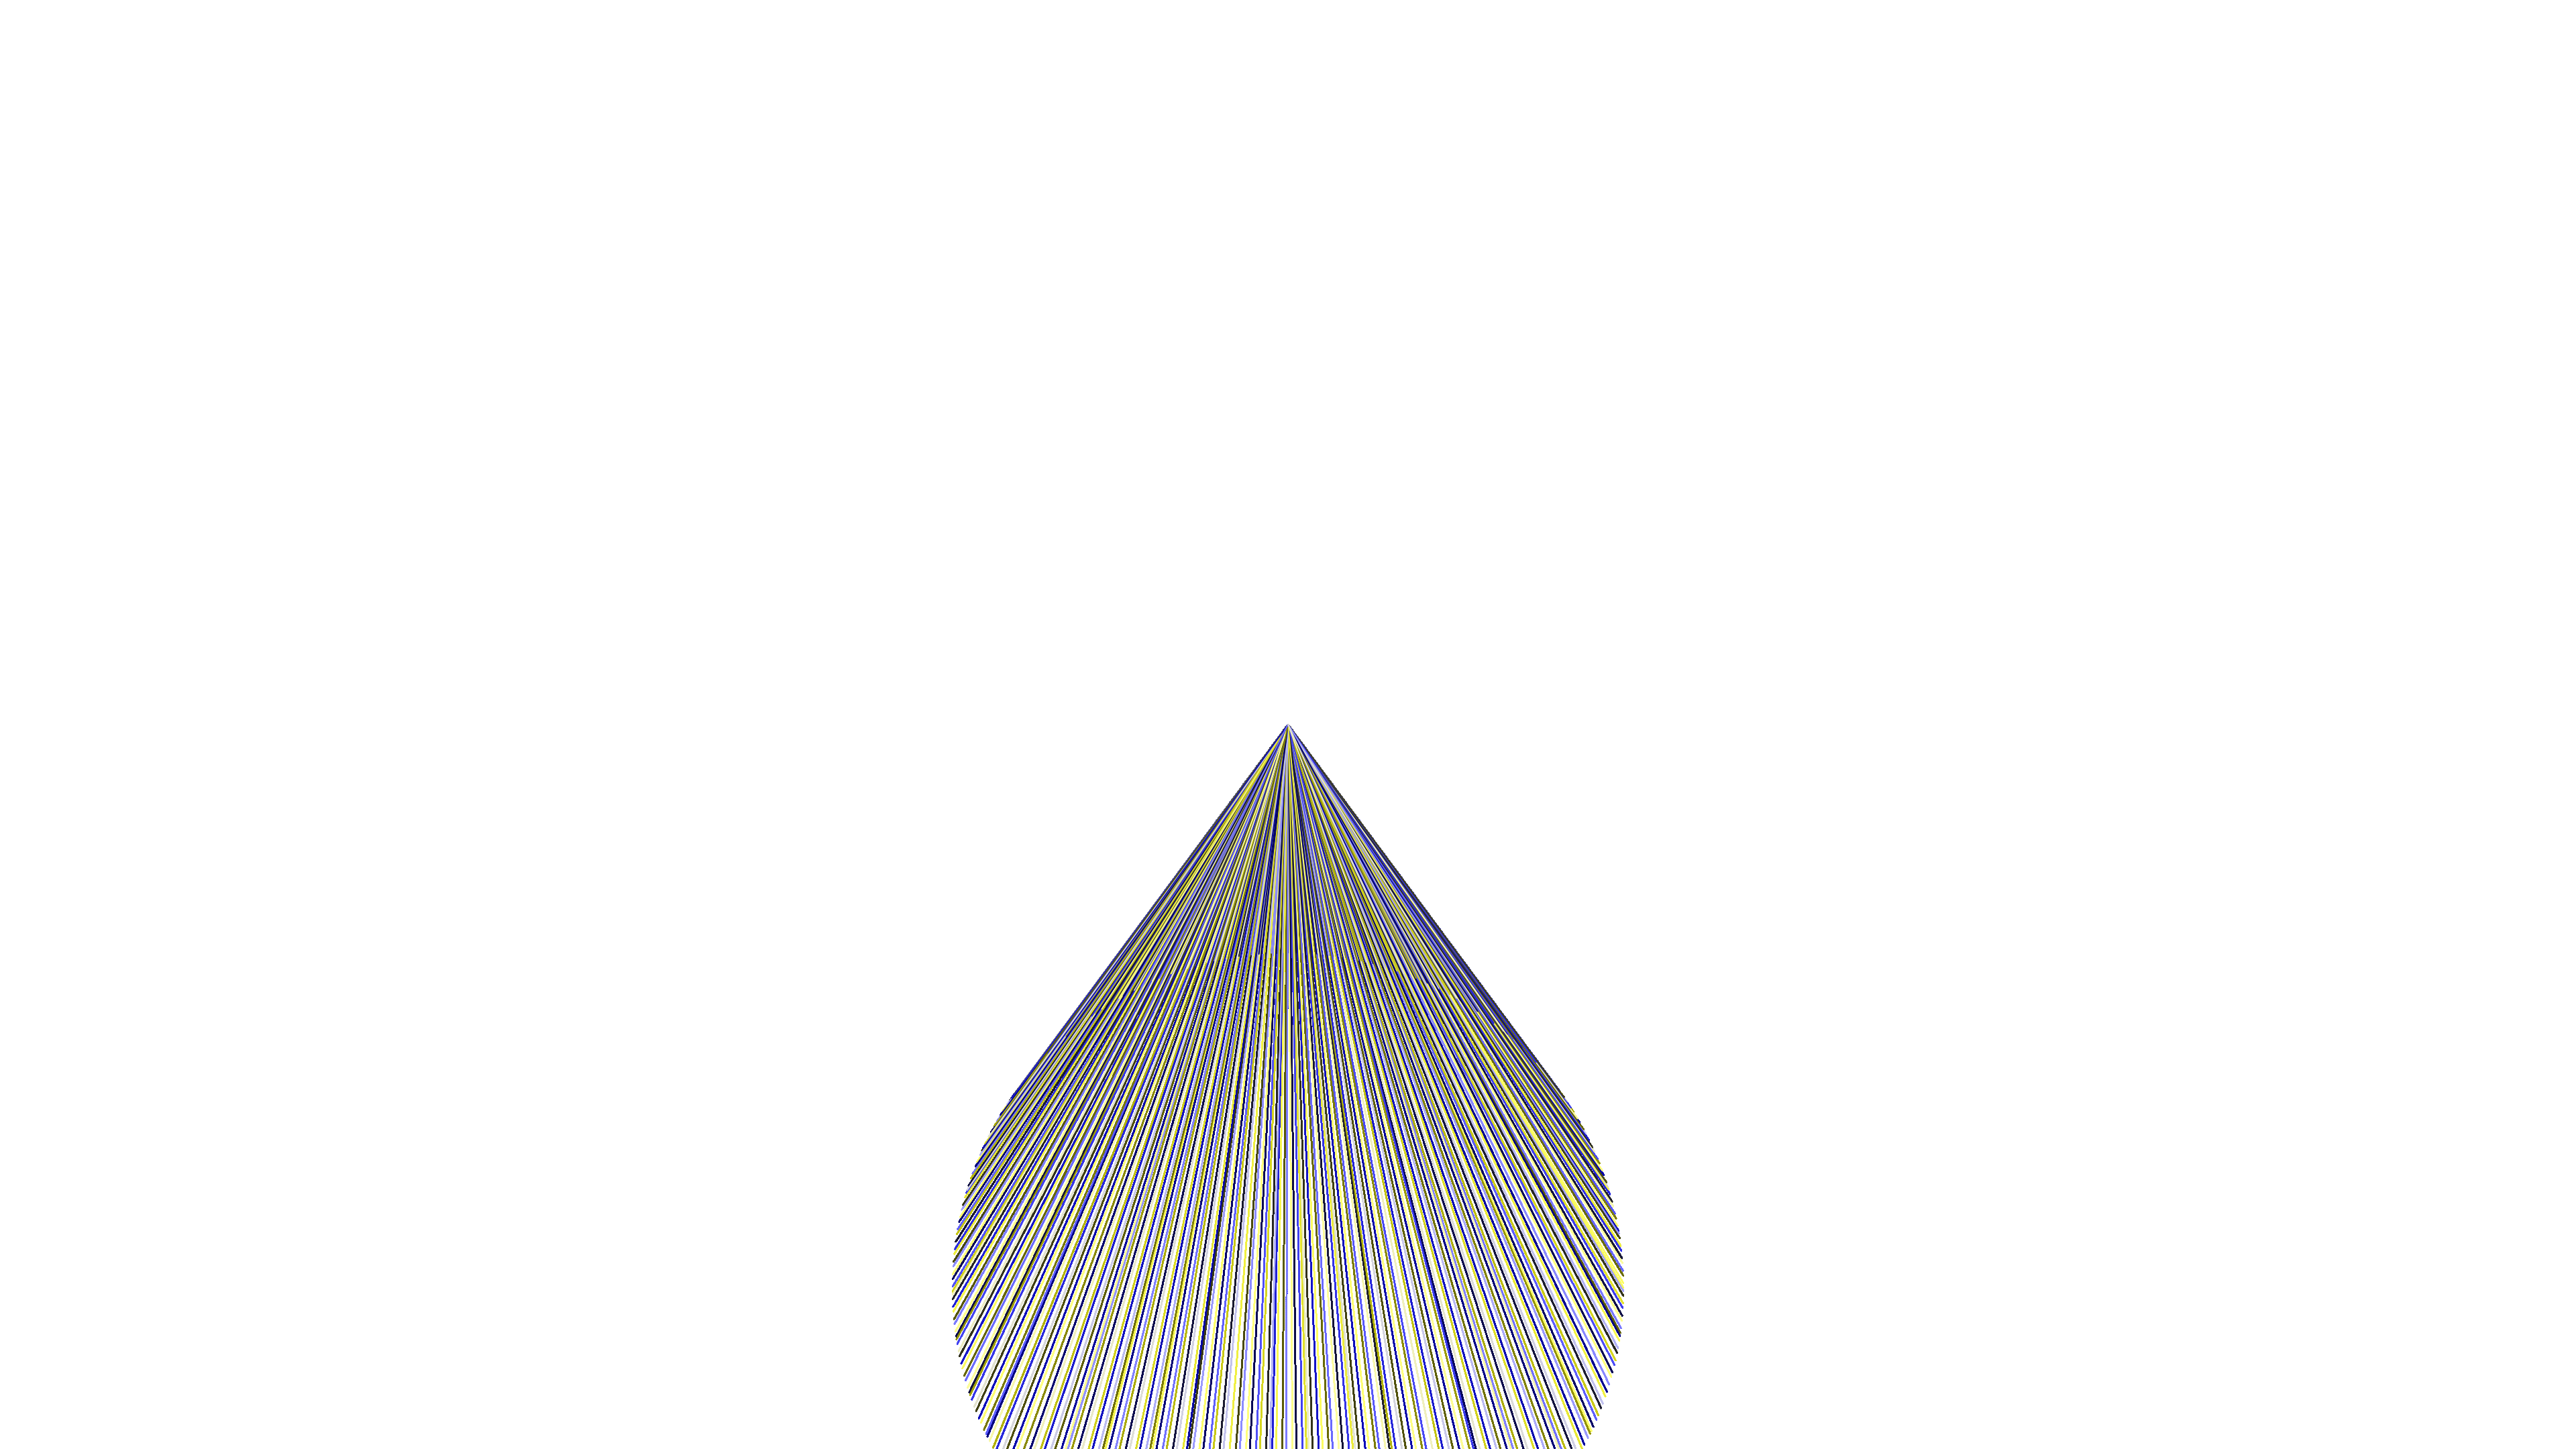
I'm not fully sure what's going on with that, but I like it. I'm going to troubleshoot this point.
Fixed:
function draw() {
  radius = 250;
  rad = 360 / (2 * Math.PI);
  for (let i = 0; i <= 360; i++) {
    line(...ORIGIN,
      ORIGIN[0] + Math.cos(i*rad)*radius,
      ORIGIN[1] + Math.sin(i*rad)*radius
    );
    s = (1 + Math.sin(i)) * 127.5;
    c = (1 + Math.cos(i)) * 127.5;
    stroke(s, s, c);
  }
}
I was actually centering the Y origin on the X origin, which means my origin was offcentered vertically by $(x/2)-(y/2)$. Good to remember for future experimentation.
In the meantime, let's mess with some stroke width. First I'm going to refactor for some clarity (I'm trying to reproduce an effect I got earlier).
Ah, fascinating, I just found a bug: the line defining rad is backward. I'm
blowing up the definition of rad. It should read rad = Math.PI/180;.
Let's rewrite a bit, and get rid of my bad Python habits:
function draw() {
  const radius = 250;
  const rad = Math.PI / 180;
  for (let i = 0; i <= 360; i+=2) {
    let rads = i * rad;
    let xOffset = Math.cos(rads)*radius;
    let yOffset = Math.sin(rads)*radius;
    line(...ORIGIN,
      ORIGIN[0] + xOffset,
      ORIGIN[1] + yOffset
    );
    let s = (1 + Math.sin(i)) * 127.5;
    let c = (1 + Math.cos(i)) * 127.5;
    strokeWeight(i);
    stroke(s, s, c);
  }
}
Math.PI / 180 is the equivalent of $\frac{2 \pi}{360}$.
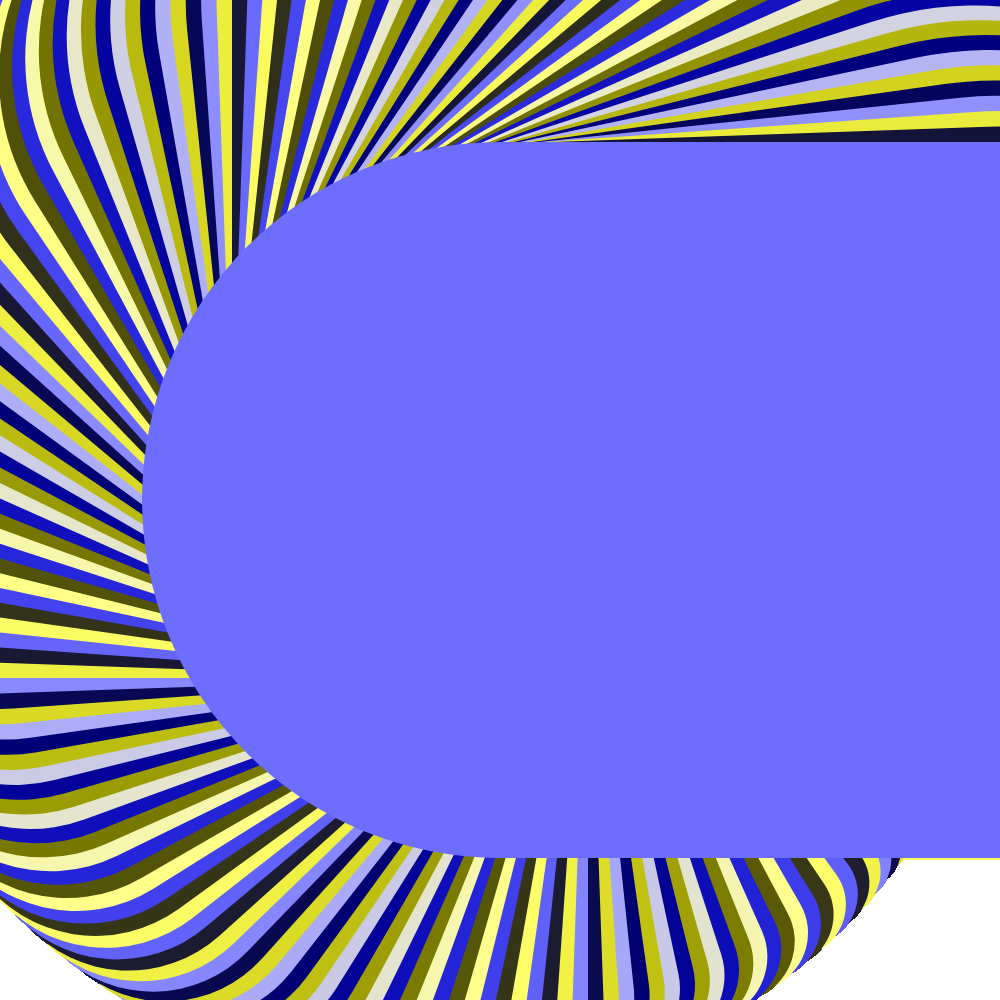
Well that's a fascinating result. Let's scale it back up to 1920x1080.
Fascinating.
Well, that's it. I just wanted to work through some of the math of programming a circle.